Leverage Next-Gen Seamless And Serverless QA Dashboard
Are you looking for a platform to manage requirements, test cases, and defects with full real-time and traceable reporting? We have a solution for you!
Meet Agile Soft QA Dashboard, a modern reporting tool that is designed for the Agile teams. Aggregate, acquire, and analyze test reports to ascertain the release health of your projects with effective QA reports. You can now check the QA reports of your tests and projects at a glance in a more scalable and efficient manner.
QA Dashboard - Modern Way To Scale Up Test Quality
Reinforce and speed up your CI/CD pipeline and get instant & real-time insights into your test coverage. QA Dashboard ensures you build confidence in your products by getting transparent test reports. The tool allows you to track your launched test cases across all the projects in one place. You can view, and analyze how your test cases perform, tract expectations, and compare status distribution.

Your QA Journey starts here!
Real-time analytics
Get real-time test analytics for all your QA test cases
Visualization of test results
Hands-on the metrics and analytics to have enhanced visibility of test results
AI-enabled Dashboard
Track the performance of test cases, reports and compare the test results

Give your team access to unmatched scalability
Centralize everything and Get enhanced visibility
Manage all your projects, tests, and reports in one place. Give your Dev and QA team full visibility, and keep them with analytical dashboards, KPI tracking, and results analysis that’s actionable.

Live Monitoring
Monitor your application or software’s performance live with the test report and empower your team for better tracking and analysis. Use the collected history of executions and fail patterns to achieve hands-free analysis of your latest results.

Make test results analysis actionable & collaborative
Collaborate with your team members to associate each failed test with a known product bug, automation issue, system issue, or other custom defect type. Keep everything streamlined and deliver the final products bug-free.

Easy traceability with test attributes
Track how each category performs for your builds. You can visualize each category on the dashboard, with the help of different test attributes such as test name, start & end timestamps, and the test status.

Analyze metrics and analytics
Leverage out-of-the-box reports for quality and coverage analysis on metrics that are essential for the ROI of your business. Analyze the health of your product with analytical dashboards and metrics to learn from the past and predict trends.

Plan, and prioritize tests efficiently with smart scheduling
Smartly prioritizes the essential tests with QA Dashboard, so that you can optimize your test cycle without compromising the quality of the project. An effective planning process helps to improve environment coverage, and ultimately increase your ROI.
How Its Works?
Add a project
Conduct the test cases
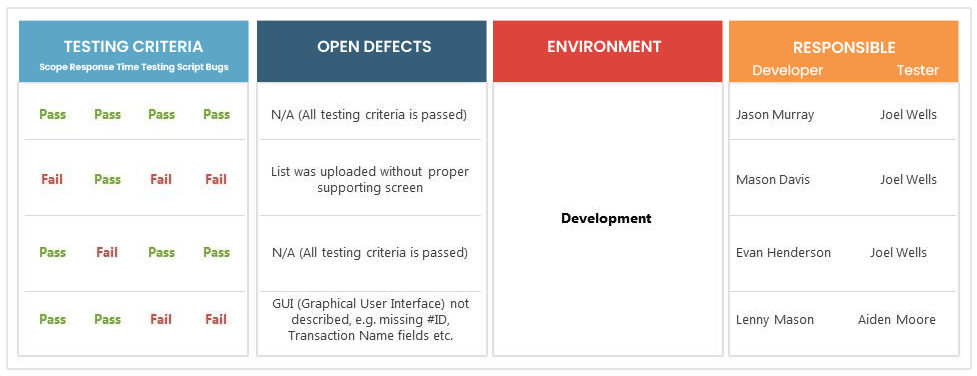
Get the test-based reports with the success status either pass/fail
Visualize your stats and metrics on the dashboard